Since August 9, Bittensor’s (TAO) price has experienced a steady daily decline. This downward trend contrasts sharply with the altcoin’s performance from August 5 to 8, when prices were rising.
Holders had hoped that TAO would build up on the increase and retest the previous week’s high. However, it also appears that the same investors are responsible for this downturn.
Project Development Is Not Enough to Drive Bittensor Accumulation
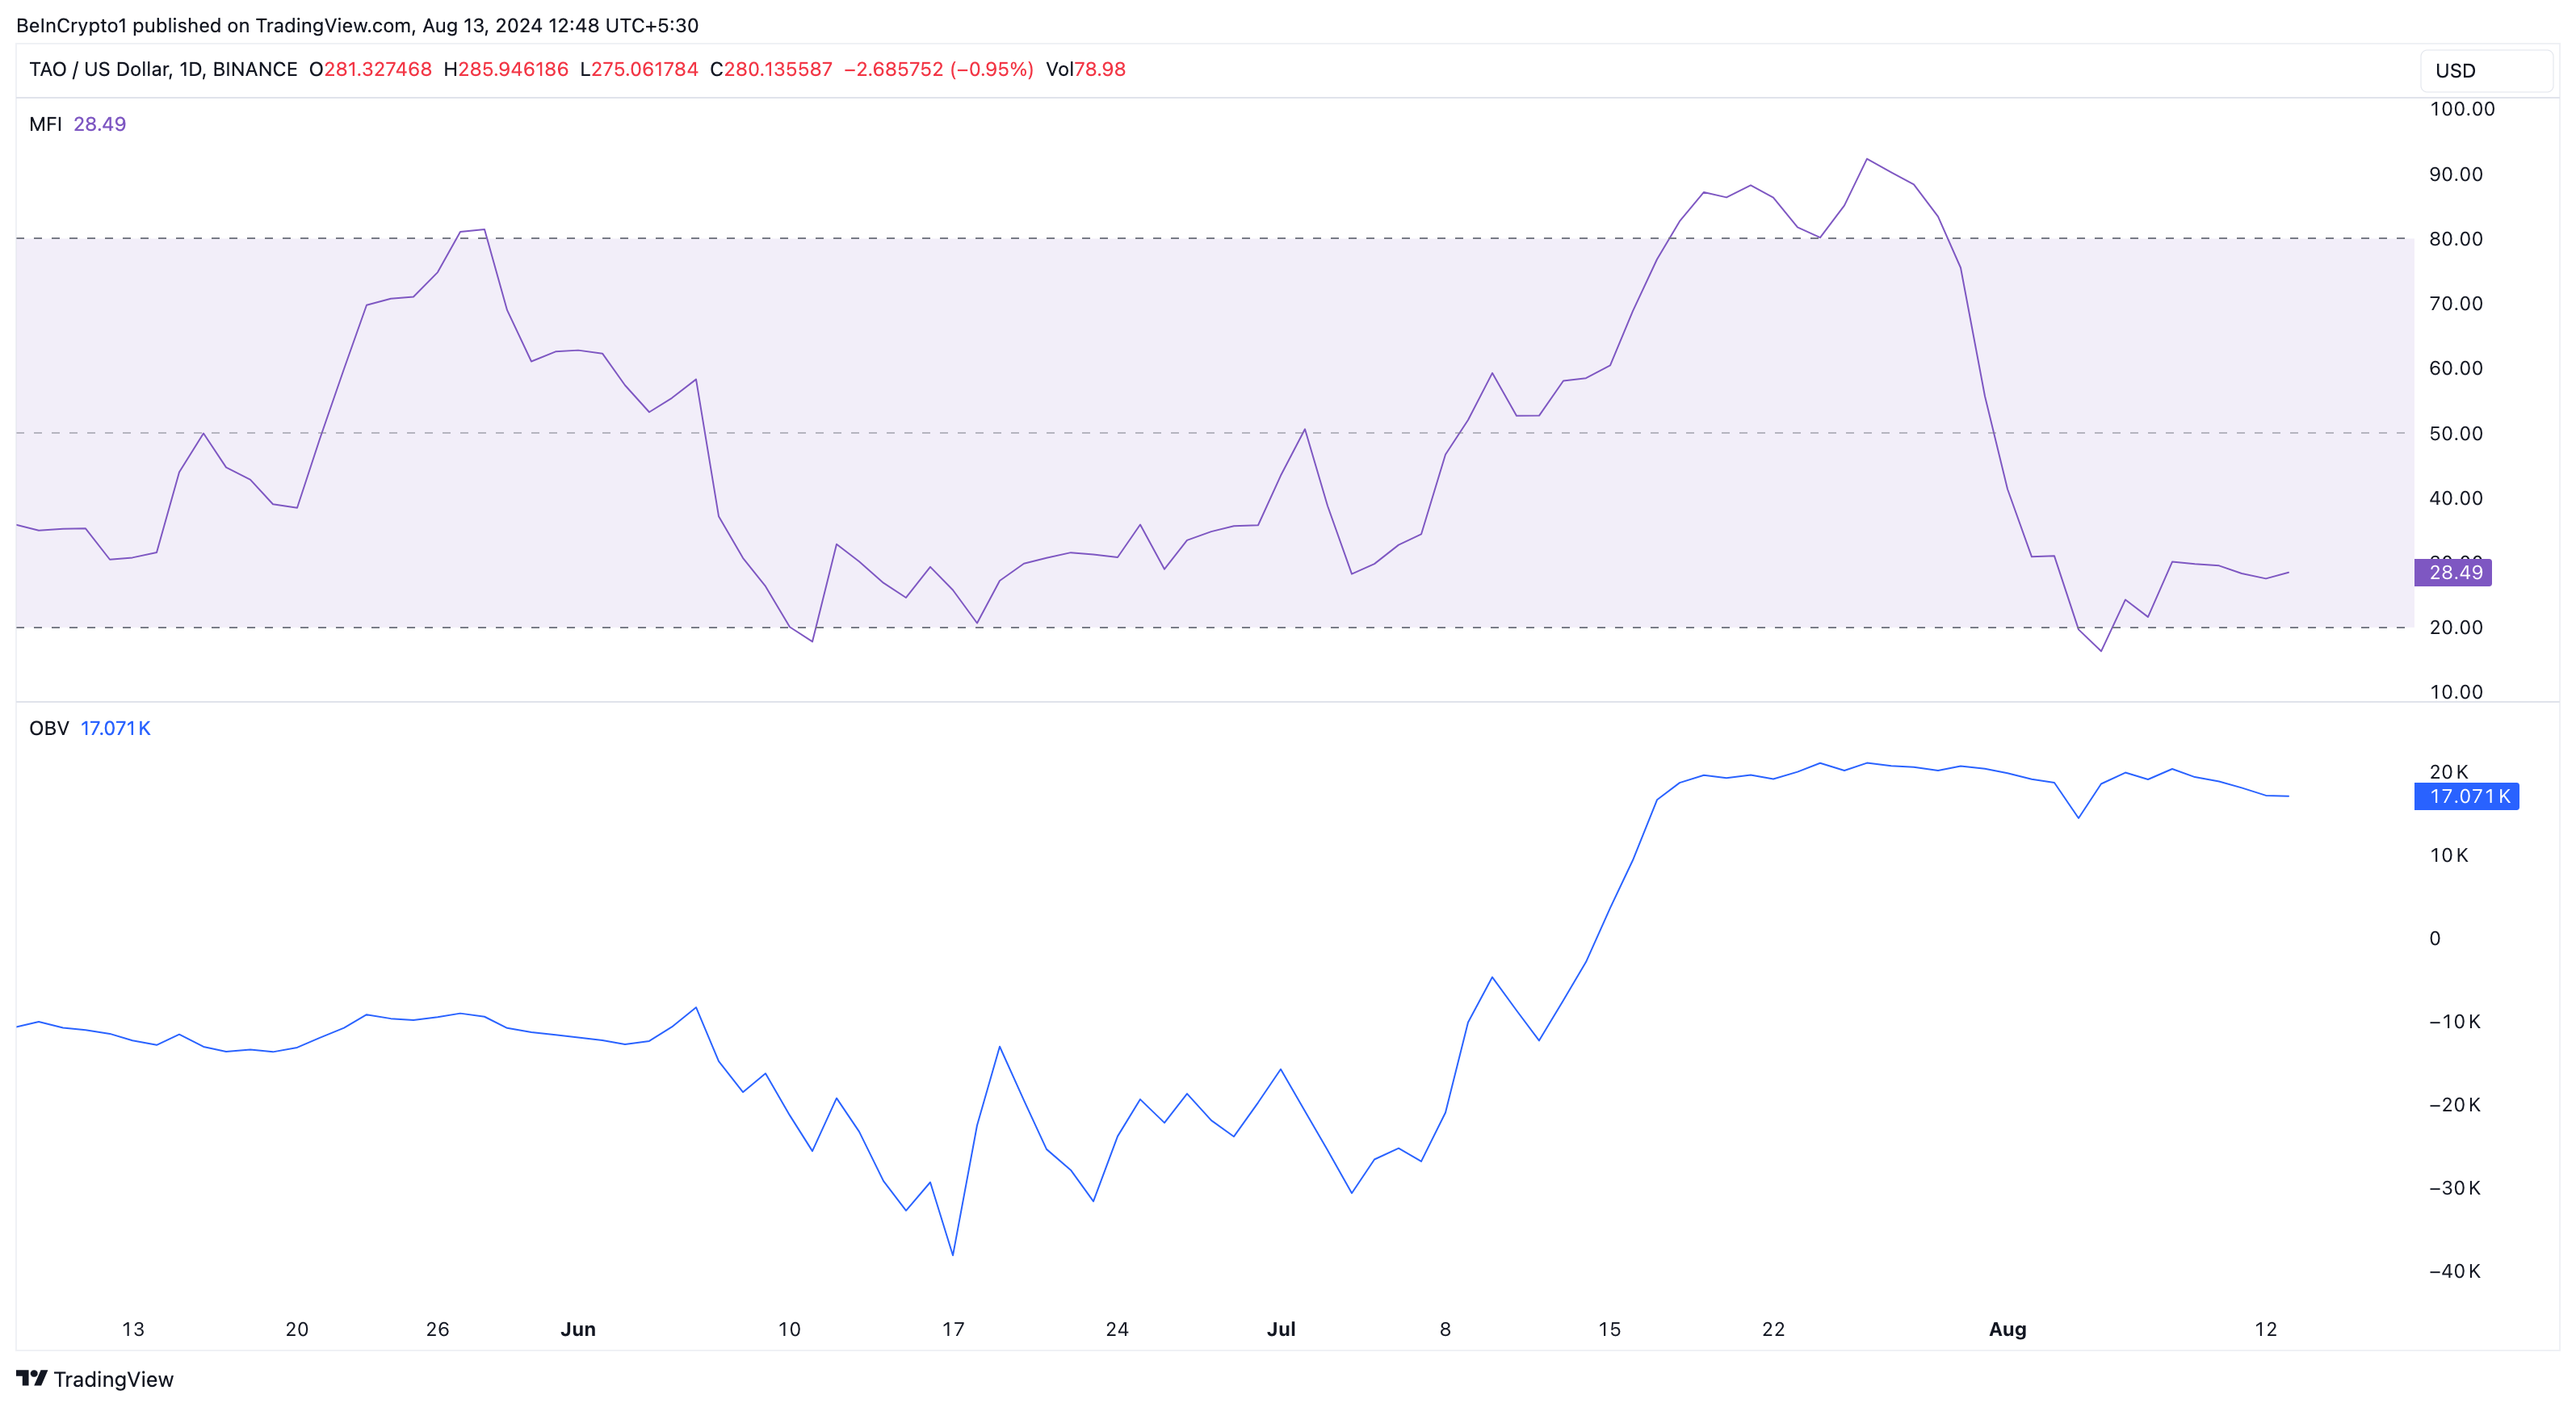
At press time, TAO trades at $278.93, representing a 15% drop within the last four days. According to the daily chart, the Money Flow Index (MFI) and the On Balance Volume (OBV) have remained around the same spot since the decline began.
The MFI swings between 0 and 100, measuring the buying and selling pressure around a cryptocurrency using the price and volume. When it rises, it infers a rise in buying pressure. However, a drop suggests increasing selling.
But since the indicator stalled, it implies that TAO investors are sitting on the sidelines, not actively buying or selling the token. Like the MFI, the OBV measures buying and selling pressure. However, this indicator only considers the volume and has a similar interpretation to the former.
Read more: How To Invest in Artificial Intelligence (AI) Cryptocurrencies?

As seen above, the OBV on Bittensor’s chart remains steady, indicating that investors may no longer expect a price increase. This sentiment contrasts with last week when TAO surged after Grayscale added it to their investments.
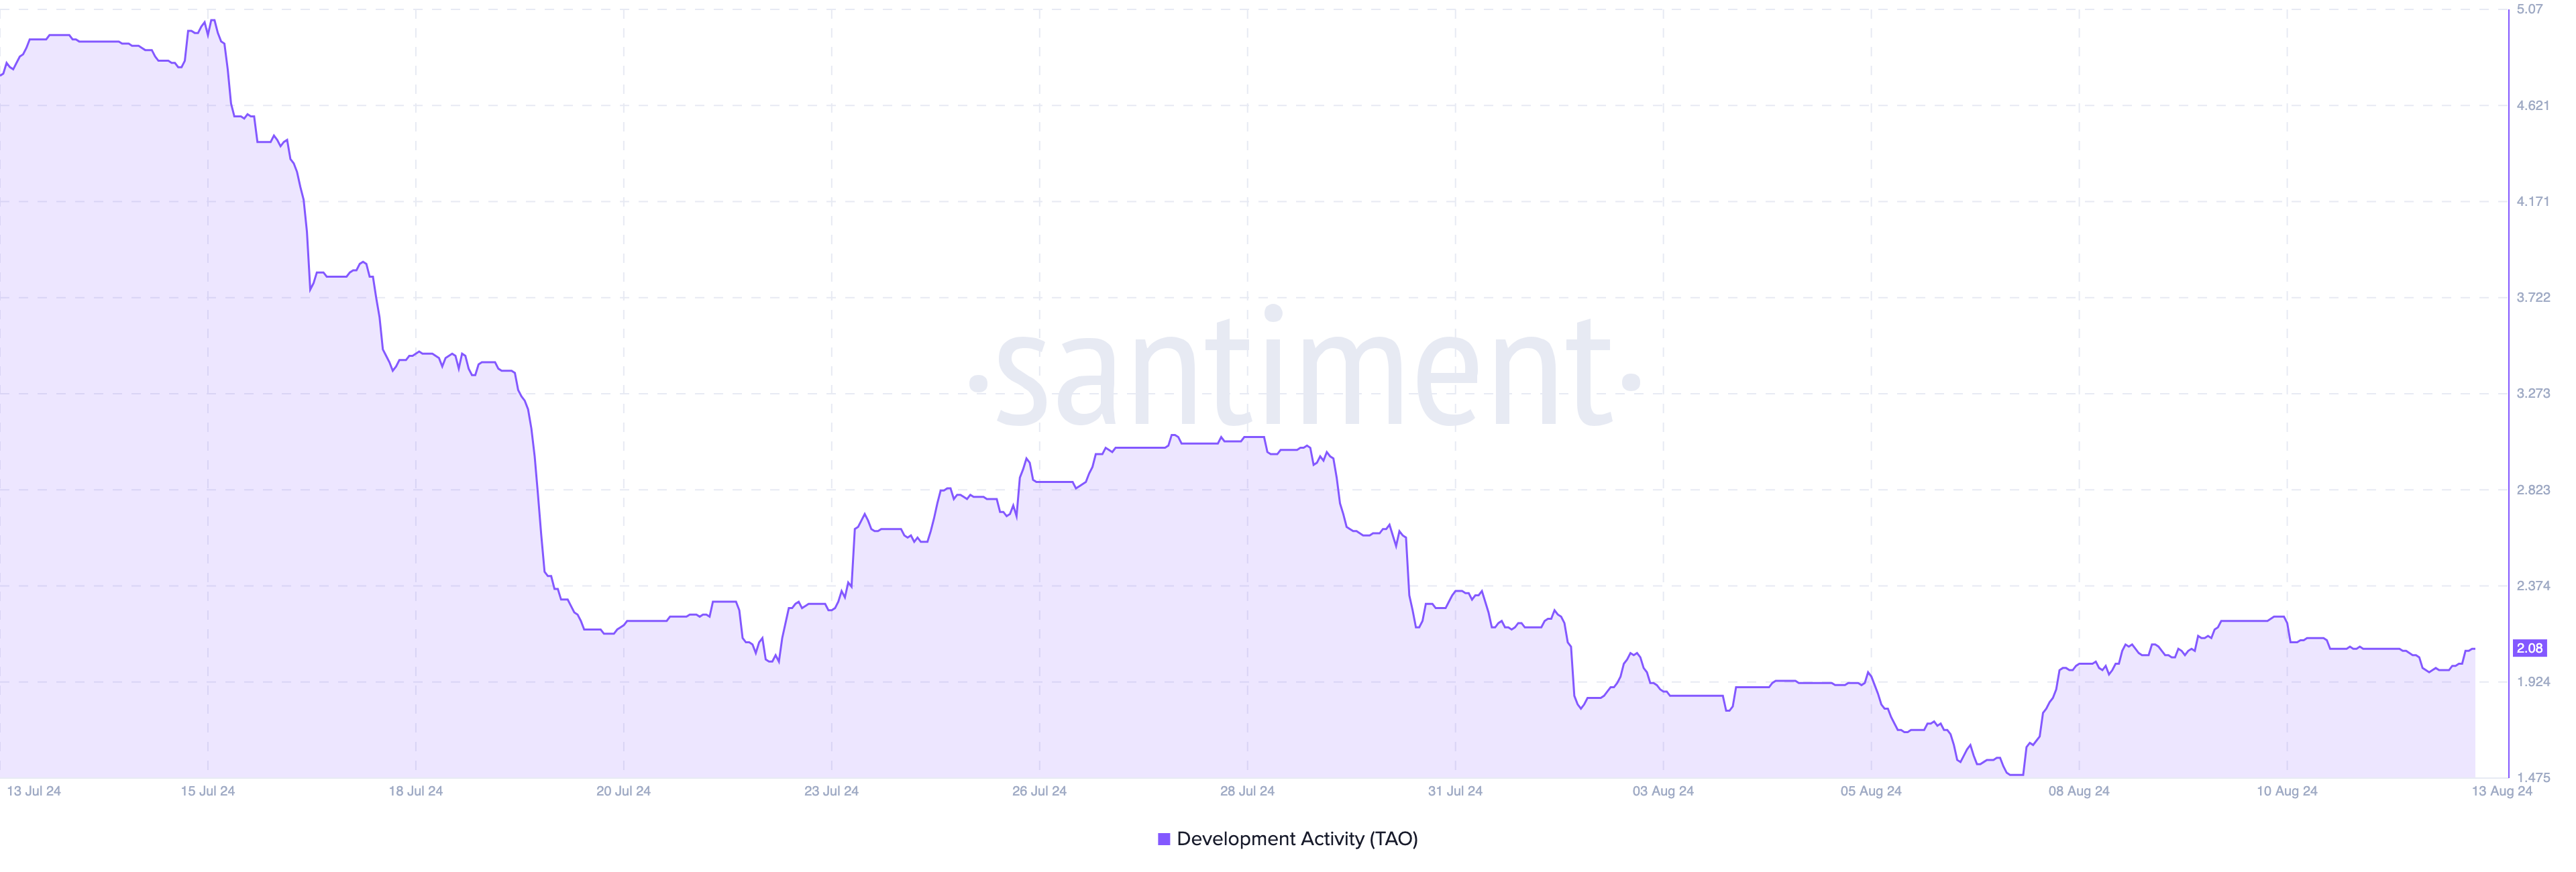
In the meantime, on-chain data shows that Bittensor’s development activity has improved, suggesting that work is being done behind the scenes to fix issues and add new features to the blockchain.

TAO Price Prediction: Bulls Falter as Price Eyes $241
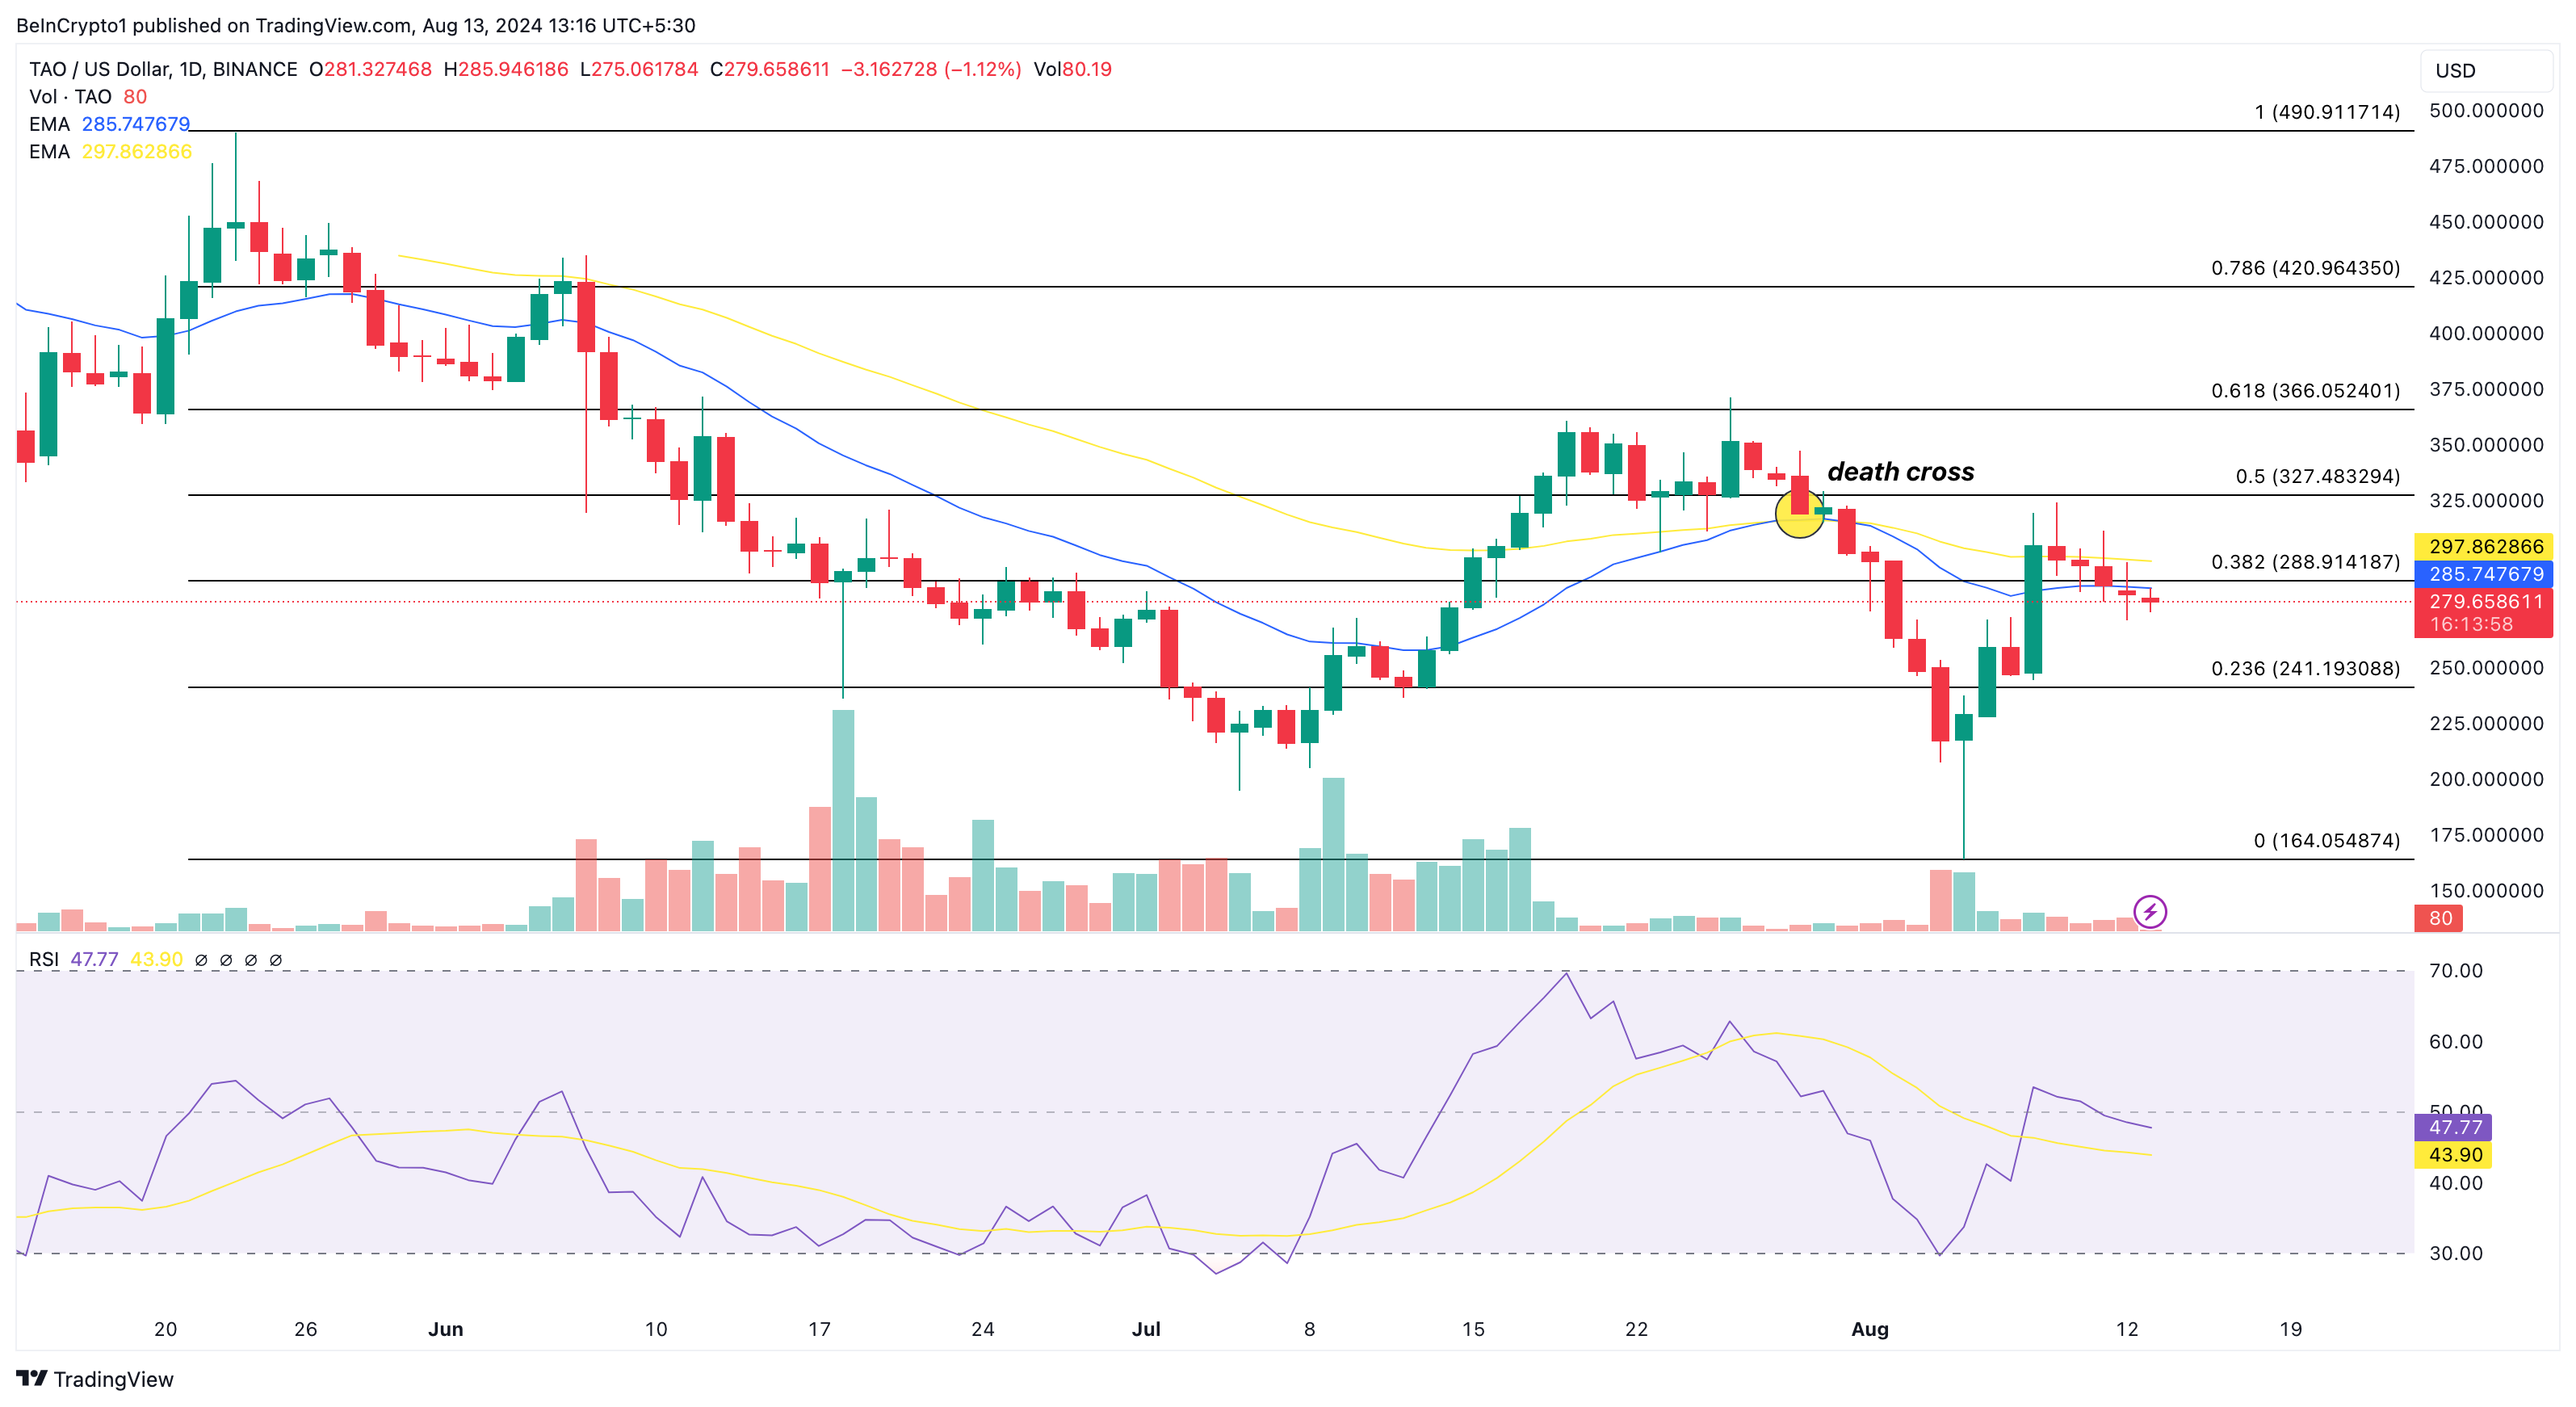
Another look at the chart shows that bulls had attempted to push TAO higher but faced a roadblock. This is evident from the signal shown by the Relative Strength Index (RSI).
The RSI, which measures momentum, crossed above the neutral 50.00 line on August 8, signaling a potential price increase for TAO. However, this is no longer the case, as the RSI has since dropped, indicating that the bullish momentum has weakened and is not strong enough to sustain a continued rise in price.
The Exponential Moving Average (EMA) also adds more context to this position. The EMA measures trend direction over a given period of time. As of this writing, the 20-day (blue) and 50-day (yellow) are above TAO’s price, suggesting that the trend is bearish.
Termed a death cross, the longer EMA’s rise above the shorter one reflects price weakness, suggesting that the token may continue to fall. If it is the other way around, it will be a golden cross.
Read more: Top 9 Artificial Intelligence (AI) Cryptocurrencies in 2024

From the image above, TAO’s price may drop to $241.19, where the 0.236 Fibonacci retracement indicator lies. For context, the Fib indicator spots price levels that may act as support or resistance.
However, if investors begin to buy TAO again, the price prediction may change. Should this be the case, TAO may increase to $288.91 or approach $327.48.
Disclaimer
In line with the Trust Project guidelines, this price analysis article is for informational purposes only and should not be considered financial or investment advice. BeInCrypto is committed to accurate, unbiased reporting, but market conditions are subject to change without notice. Always conduct your own research and consult with a professional before making any financial decisions. Please note that our Terms and Conditions, Privacy Policy, and Disclaimers have been updated.


