

Celestia (TIA) has attracted broader market attention as one of the best-performing altcoins over the past seven days, with its price rising by 14.5% to $5.57.
However, on-chain data suggests that despite this recent surge, the native token of the modular blockchain project might struggle to sustain its upward momentum.
Celestia Rally at Risk Due to These Factors
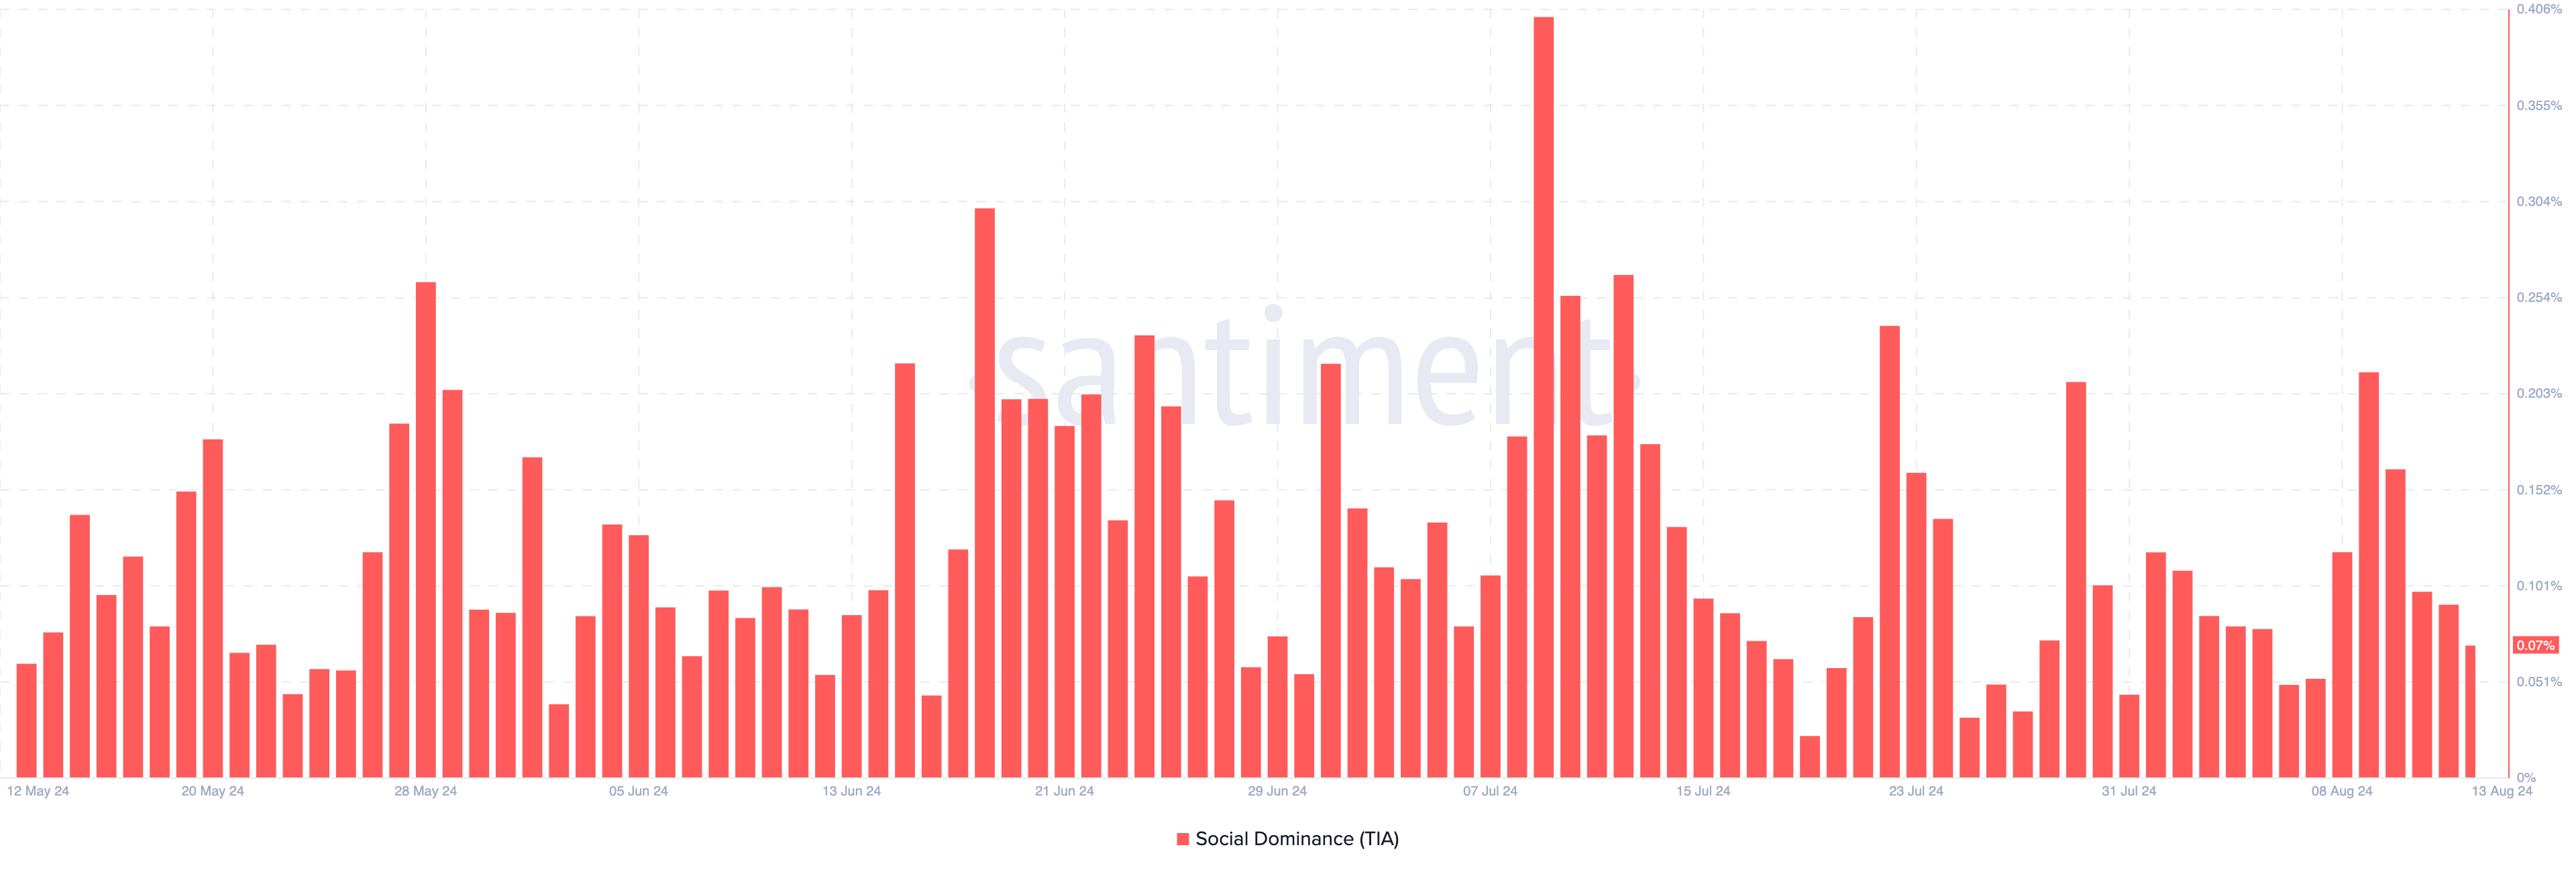
One indicator pointing to a potential decline in Celestia’s price is its social dominance. Social dominance measures the proportion of discussions about an asset compared to other top 100 cryptocurrencies.
For example, if a project has 30% social dominance, it means that 30% of social media posts or messages about top 100 cryptos are focused on that project. An increase in this metric indicates growing market attention, as was the case with TIA until August 9, when it reached a weekly high of $6.20.
However, as of now, TIA’s social dominance has dropped to 0.07%. If this decline persists, it could lead to a decrease in TIA’s price.
Read more: Best Upcoming Airdrops in 2024
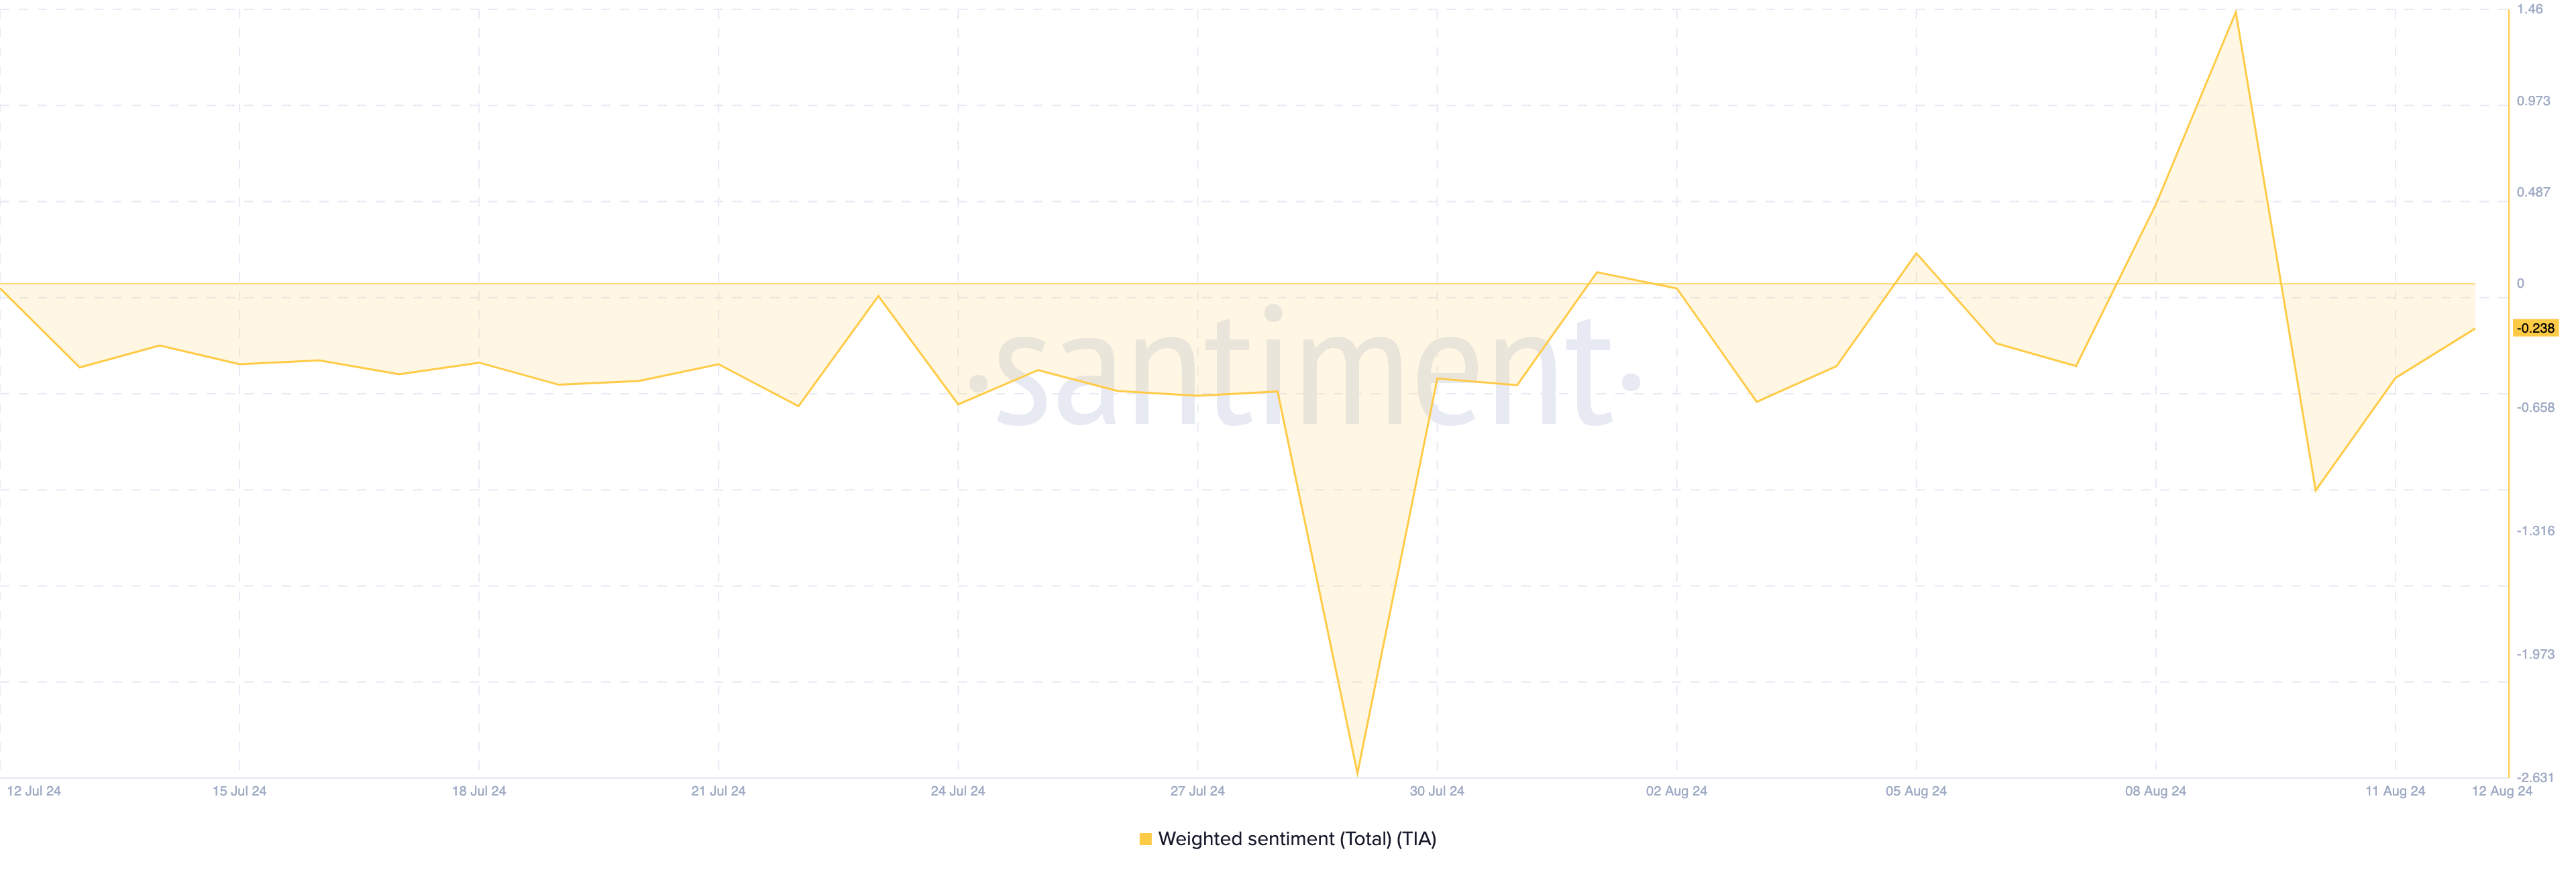
Despite the potential for a downturn, sentiment around TIA appears to be improving. According to Santiment, the Weighted Sentiment for TIA currently stands at -0.238. This metric measures whether online comments about a cryptocurrency are generally optimistic or pessimistic.
A negative reading suggests more pessimism, while a positive reading indicates bullish sentiment. Previously, the reading was -1.069, which shows that although sentiment is still negative, it has improved.
If the Weighted Sentiment turns positive, demand for TIA could increase. However, as long as the sentiment remains negative, it may be difficult for the token’s price to maintain its upward trend.
TIA Price Prediction: Consolidation Ahead?
The technical perspective shows that despite the price increase, TIA’s price has failed to break above the descending trendline. Typically, when the price of a cryptocurrency breaks past the trendline, it could serve as a signal for a bullish continuation.
However, failing to do so may keep TIA’s price stuck below the trendline. Additionally, the Accumulation/Distribution (A/D) indicator reveals that TIA lacks the necessary buying pressure to sustain its uptrend.
The A/D line measures whether there is more buying or distributing in the market. An increase in the indicator suggests rising buying pressure, while a decrease indicates more distribution. For TIA, the A/D indicator has remained relatively flat, suggesting that spot volume around TIA isn’t particularly high.
Read more: Which Are the Best Altcoins To Invest in August 2024?
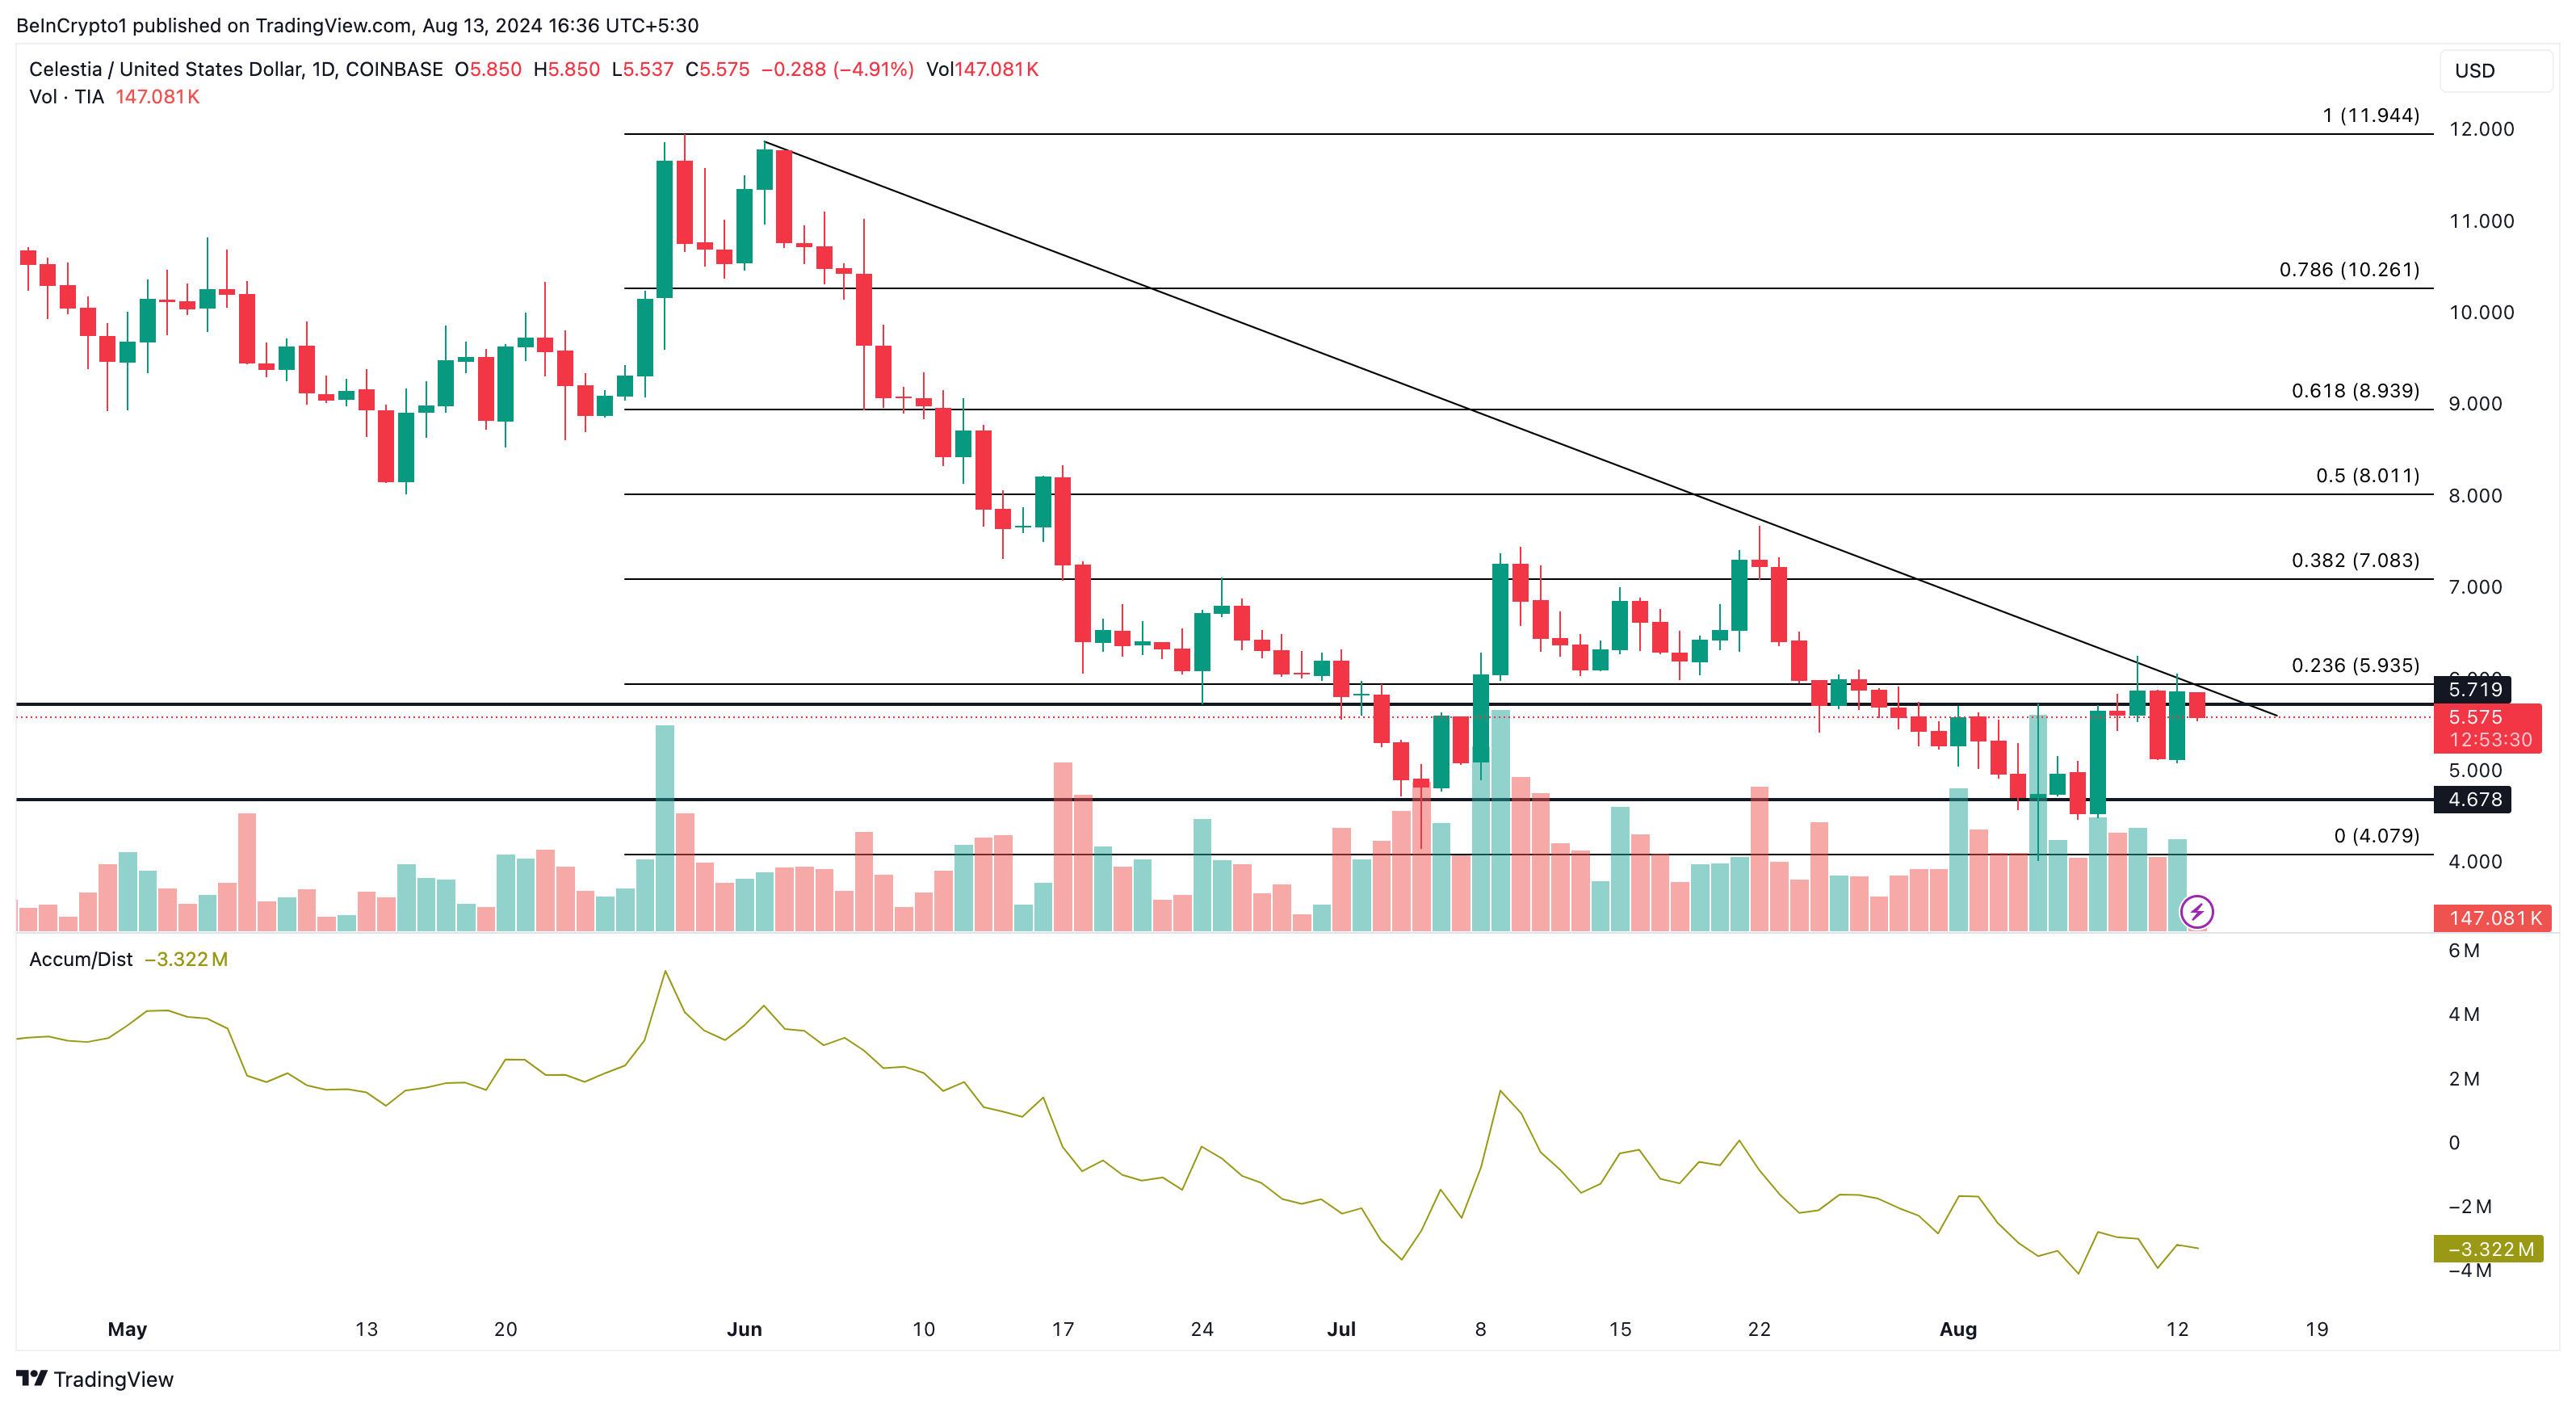
If this trend continues, TIA’s price may consolidate between $4.67 and $5.71. In a highly bearish scenario, the price may drop to $4.07. Conversely, if demand increases, TIA’s price might retest $5.93.
Disclaimer
In line with the Trust Project guidelines, this price analysis article is for informational purposes only and should not be considered financial or investment advice. BeInCrypto is committed to accurate, unbiased reporting, but market conditions are subject to change without notice. Always conduct your own research and consult with a professional before making any financial decisions. Please note that our Terms and Conditions, Privacy Policy, and Disclaimers have been updated.