Data shows the Bitcoin HODLer balance has registered a drop of around 9.8% this bull run. Here’s how this figure looked for previous cycles.
Bitcoin HODLers Have Seen Their Holdings Go Down Recently
According to data from the market intelligence platform IntoTheBlock, the Bitcoin long-term holders have gradually been decreasing their total balance recently.
The “long-term holders” (LTHs) here refer to the BTC investors who have been holding onto their coins for at least one year, without transferring or selling them a single time.
Statistically, the longer a holder keeps their coins still, the less likely they become to sell the tokens at any point. As such, the LTHs, who hold for significant periods, can be considered persistent entities. The side of the market with weak hands is known as the “short-term holders” (STHs).
Now, here is the chart shared by IntoTheBlock that shows the trend in the combined holdings of the Bitcoin LTHs over the past decade:
The value of the metric appears to have been on the decline in recent months | Source: IntoTheBlock on X
The above graph shows that the Bitcoin LTHs have been reducing their supply this year. More specifically, the total balance of these HOLDers has decreased by around 9.8% during this downtrend.
The LTHs have decided to break their dormancy whenever this metric registers a decline. Generally, this happens because they want to participate in some selling.
Something to note is that while selling is something that can instantly appear on the indicator, the same isn’t true for buying. LTH supply has a 1-year delay attached in terms of this, as coins can only become a part of the cohort after they have been held for at least a year.
As mentioned earlier, LTHs tend to be committed hands, so they don’t tend to sell too often. That said, even these investors are forced into selling when the profits of a major Bitcoin bull run start rolling in.
The analytics firm has highlighted in the chart how this selling looked during the previous cycles. It would appear that the degree of the decline has been less in this cycle so far than in the last bull markets.
“Long-term holder balances have fallen by 9.8% this cycle, compared to 15% in 2021 and 26% in 2017,” notes IntoTheBlock. Thus, it’s possible that the HODLer distribution could have more room to continue before the Bitcoin rally ends.
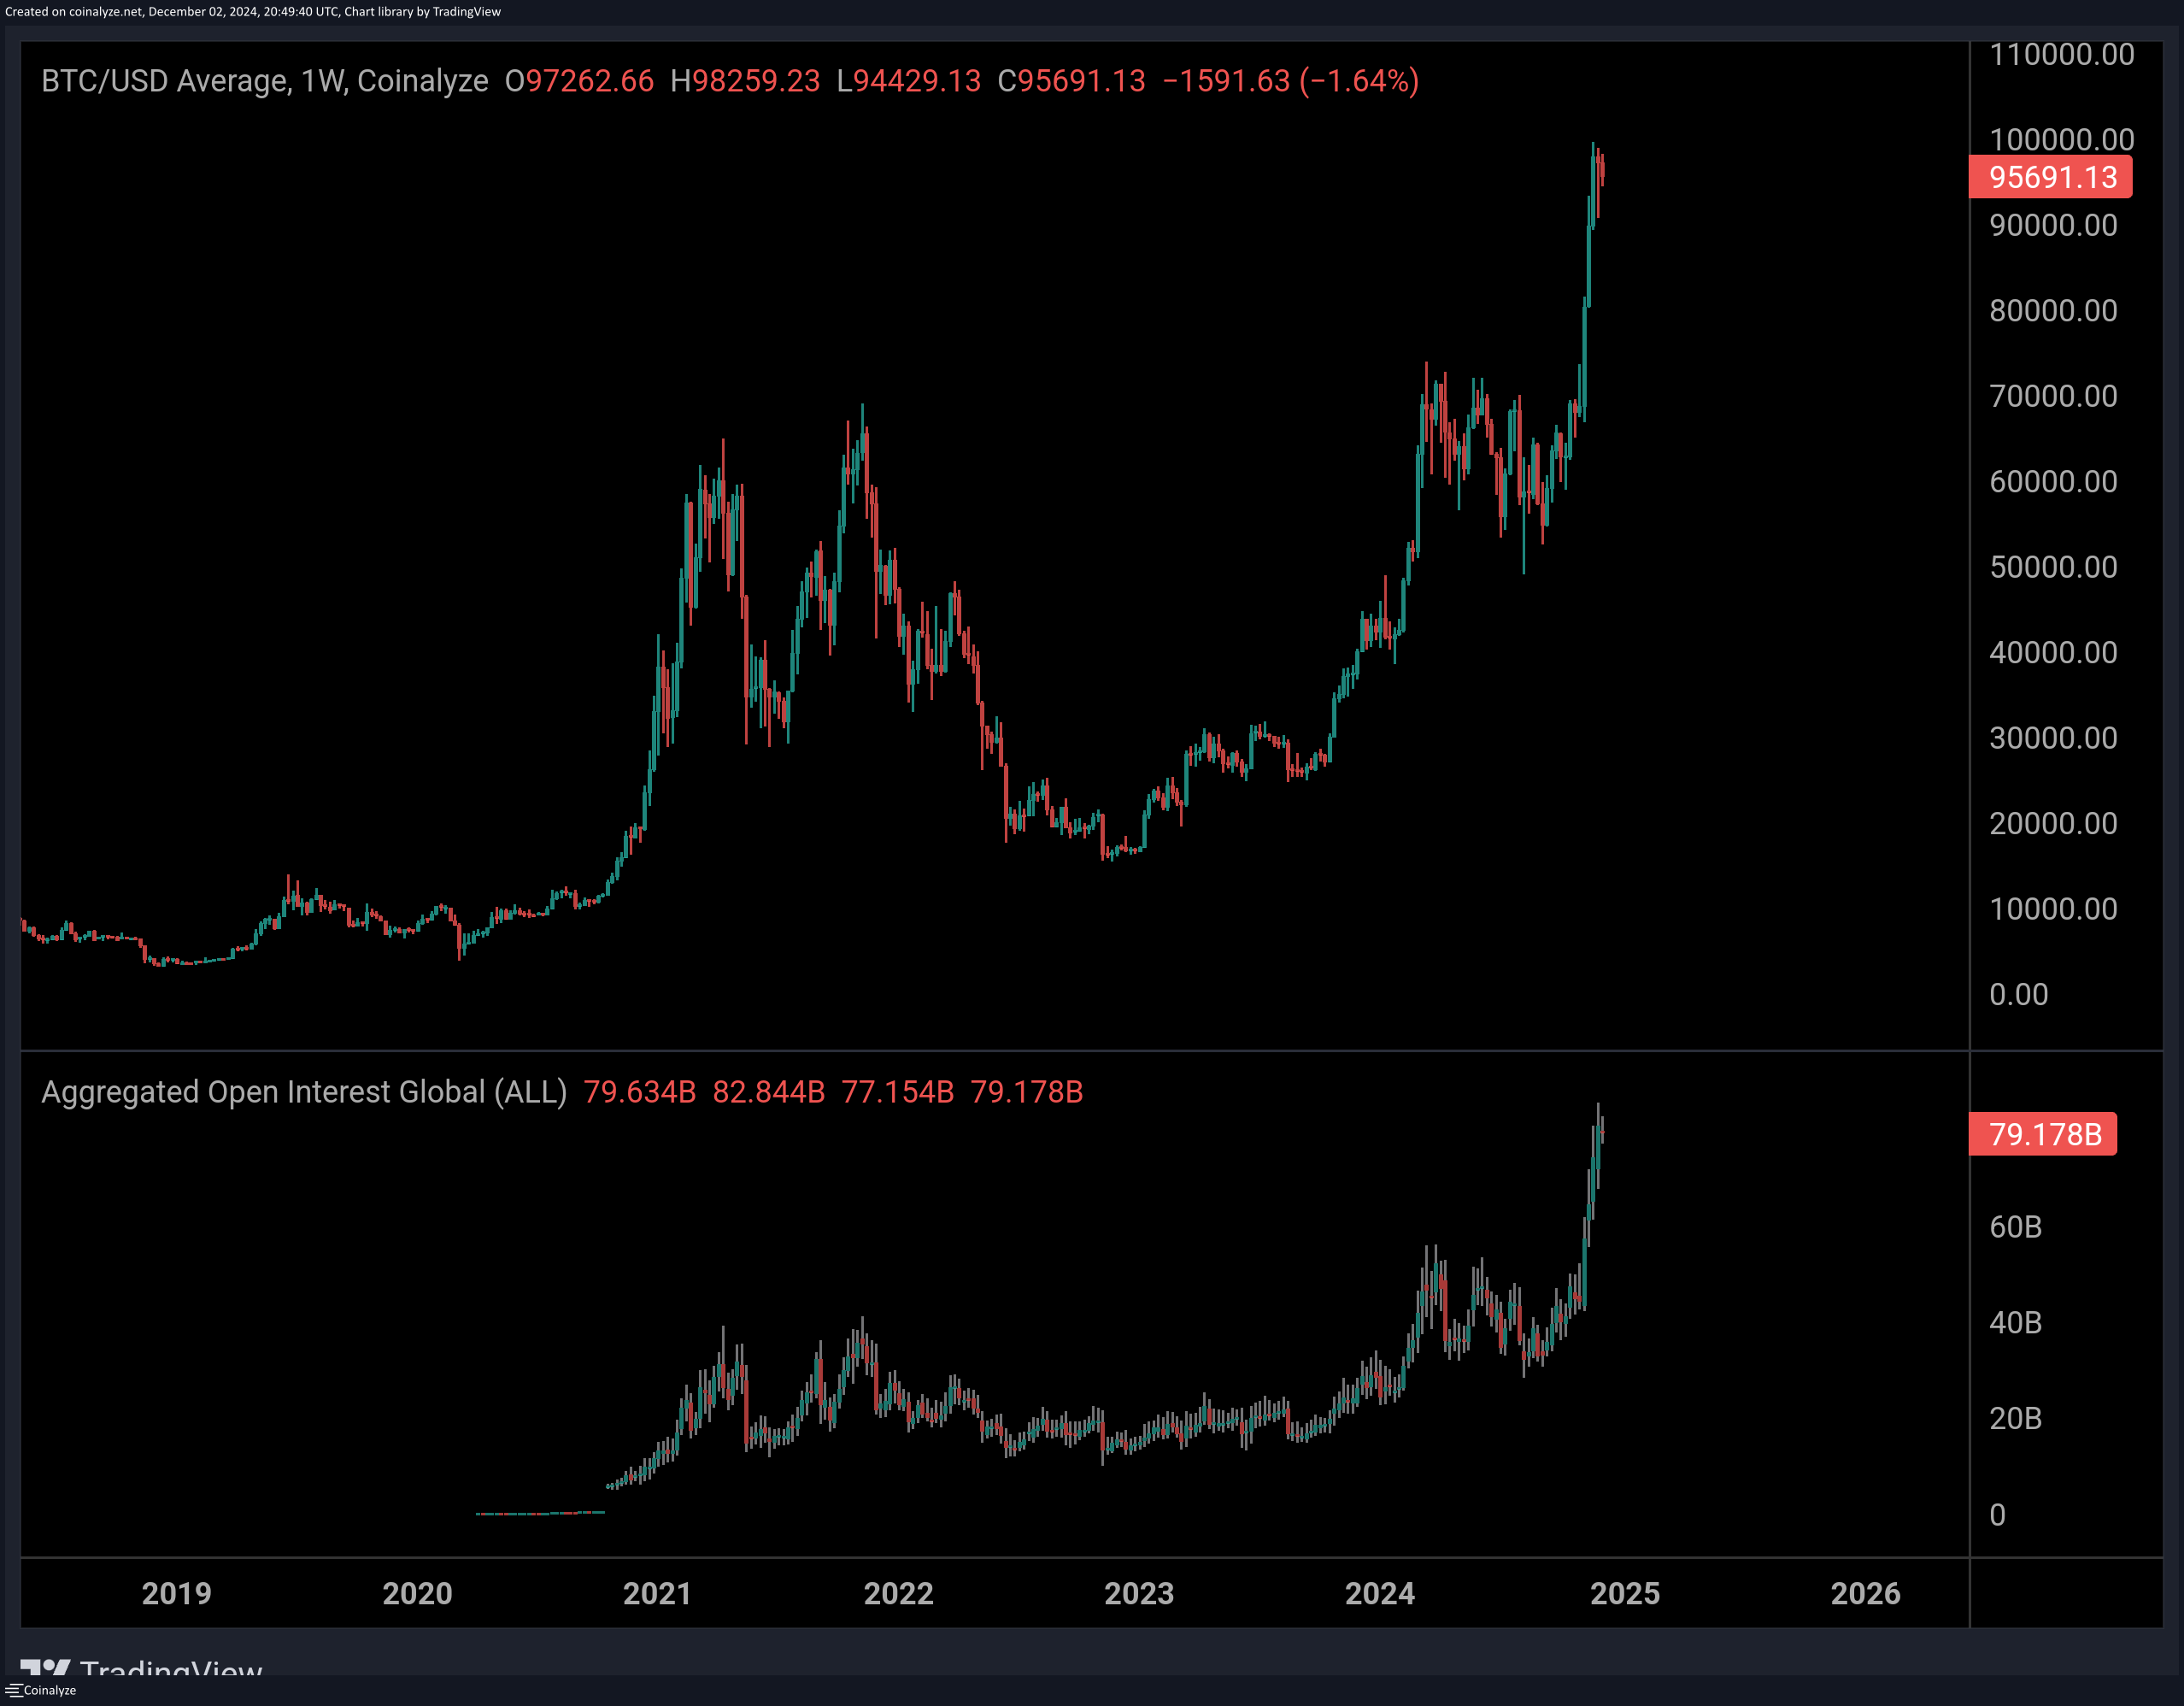
In some other news, as CryptoQuant community analyst Maartunn has pointed out in an X post, the total Open Interest for the cryptocurrency sector has shot up to a new all-time high of $79.2 billion.
Looks like the value of the metric has observed a sharp surge recently | Source: @JA_Maartun on X
The “Open Interest” refers to a measure of the number of derivatives positions that users have opened on all centralized exchanges. A spike in this indicator generally corresponds to higher volatility for the market.
BTC Price
The Bitcoin rally has gone cold as its price has been consolidating sideways around the $95,800 mark recently.
The price of the coin has been stuck in sideways movement over the last few weeks | Source: BTCUSDT on TradingView
Featured image from Dall-E, IntoTheBlock.com, chart from TradingView.com


